

NIFTY ANALYSES.
Buy and Hold Vs without worse 5 days Vs without Best 5 days Vs 100DMA
You must have read many an article detailing how staying in the market is VERY important because if you miss the top 5 days, the results would be pathetic. And the foregone conclusion is that NOBODY can time the market, one should always be invested, always be SIPPING.
Let us dig deep with our NIFTY ANALYSES.
Here below, we plot 03 lines. 01 is Nifty buy and hold, another is Nifty without top 5 days and the third is Nifty without worse 5 days.

Let us understand the graph in terms of Compounded annual growth rate.
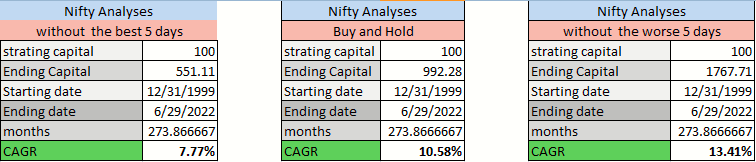
so as you can see, if you can avoid the worse 5 days, you end up with Rs 1767 compared with Rs 992 if you were a buy and hold. Similarly, you would have received Rs 551 or FD return if you had missed the top 5 days in Nifty.
Point is, does this data conclude anything at all. Lets see if moving average segregation helps us in understanding any clustering of these top and bottom 5 days. We plot a 100-day moving average and see how many of the worse/best days happened above below 100day moving average.
Lets examine the worse 5 days
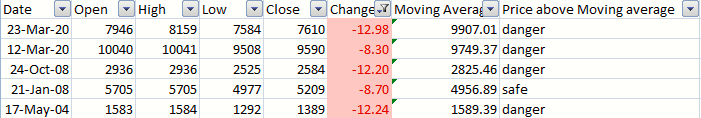
As you can see, by simply following a 100-day moving average, you would have successfully avoided 4 out of 5 worse falls in Nifty. 21st Jan 2008 was the only occasion where this Moving average would not have saved you. There is NOTHING NEW in this data, Stock prices exhibit this feature ALL THE TIME. All the majority of collapses in the history of the stock market happen below key moving averages. No trend follower ever witnessed a Satyam or a yes bank or a dhfl crash. They were OUT months before the shit hit the fan.
But wait for a second, what would happen to BEST DAYS. This 100-day filter might throw us out of that!!!
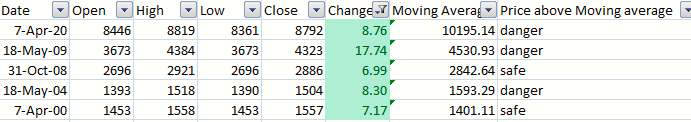
Our fears were well-founded, we missed 03 out of 5 BIG days. Nothing surprising there as well. Bear market rallies are the MOST ferocious. The rebounds/short coverings are vicious. No wonder, short selling is a rare elusive art that only 1 in a million possesses.
Our ending Equity curve with 100DMA is as follows, Also max DD compared with buy and hold comes down by 6% (54 Vs 60)