
One of my friends/client asked me a very interesting question. He said
“wouldn’t this market fall look like a blip on a 20 year chart of a buy and hold investor”?!
This is a one great myth being circulated in the markets about how compounding works and why if you buy and hold forever, you would somehow retire very rich.
My doubt is that it has to do with perverse incentives, but I may be wrong. Anyways more on that later.
Many investors count on compounding, called the greatest mathematical discovery of all time, to help them achieve financial independence. Yet many people confuse it for “average return.”
You do not know how compounding works, if you think market corrections are just a small blip.
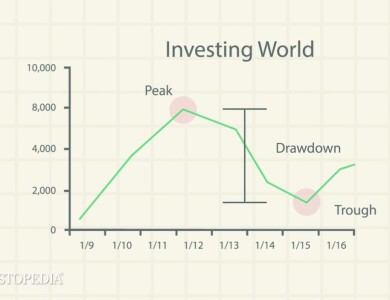
These blips are called draw-downs and I am going to dedicate this blog in explaining its effect on CAGR. You will be shocked out of your wits to see the damage one negative year does to your CAGR and your end result.
In fact the shock is so huge that an understanding will sink in that it is better to have small increments every year rather than home run years followed by one horrible year.
But your friendly buy and hold advisory will not disclose this or else they would not have any turkey (you) for dinner.
The best way to explain it is with an example.
|
Portfolio 1 |
Returns |
Portfolio 2 |
Returns |
|
100000 |
20 |
100000 |
20 |
|
120000 |
30 |
30 |
|
|
156000 |
10 |
-20 |
|
|
171600 |
10 |
10 |
|
|
188760 |
10 |
10 |
|
|
20768 |
18 |
18 |
|
|
245010 |
20 |
20 |
|
|
294012 |
20 |
20 |
|
|
352812 |
10 |
10 |
|
|
388096 |
10 |
-20 |
|
|
426906 |
40 |
80 |
|
|
597668 |
12 |
12 |
|
|
669368 |
9 |
9 |
|
|
729634 |
15 |
15 |
|
|
839079 |
30 |
60 |
Look at the figures above. Portfolio 02 had 02 years out of 15 where the returns were twice that of portfolio 01. (Double return in year 15 and year 11)
However it had 02 years where the return was in negative while Portfolio one had a marginal 10% year.
Who do you think won in the end? The answer is going to be counter intuitive ladies and gentlemen.
Portfolio 1 Final Score 1090802, which is a CAGR of 17.27%
Portfolio 02. Final Score 912981. which is the CAGR of 15.89%
That is an ALPHA of almost 02% cagr over 15 years timeframe. Just in case you are thinking its only 02%, remember 2% CAGR on 15 years is HUGE. If you start from a decent base, the difference between the 02 portfolios will be mind boggling.
So what just happened.
I’ll tell you what happened, its called DRAW-DOWN, negative return is like Termite that corrodes the wood in the background in a slow and subtle way.
So the blip that you see on a 20 year chart can have a HUGE impact on your returns and what corpus you retire with. This is because every time you lose 50%, you need to gain 100% just to break even.
This is the reason why idea of buying basis CAPE ratio is something I totally relate to. Everything moves in cycles and mean reversion is a fact of life. As proved in back test reports of last 50 years data done by Wes Gray, Your draw-down reduces considerably when you pay historically low prices for the stock you have bought. And If you pay a hefty price, no moat is good enough to protect your back side.
Similarly Asset Allocation based on valuation/momentum matrix makes so much sense. When the trend is down, you stay out or better still in gold (as equity rally and gold rally are inversely correlated)
I am really impressed by the pioneer work Meb Faber and Wesley Gray are doing to mitigate the draw-down aspect of portfolio returns. Please visit their respective websites to know more about them.
Leave alone the affect on returns, draw-downs are not good for health either. I do not know of many stoics in the market who can be indifferent to 50% of their portfolio getting wiped off.
Consider the above 02 portfolios. On 02 different years portfolio 2 earned twice than portfolio 1 but even that could not reprieve it
Siegel, in his book, “Stocks for the Long Run,” explores the effect on performance on the Dow Jones Industrial Average from 1886 to 2006, when applying a 200-day moving average rule.
And the results are astounding to say the least. Majority of shit (like fraud, sudden fall from grace, skeletons from closet) happens to a stock below its 200 DMA hence saving a trend follower from junk.
Negative Returns
Let’s first look at the impact negative returns have on your portfolio. You have worked hard to save $100,000 and you want to invest it in the market. In the first year, you earn 15% on your $100,000 increasing the value of your portfolio to $115,000. Makes you feel good, right?
In the second year, the market drops and your portfolio falls 15%. So how much is your portfolio worth now? If you guessed $100,000, then you’ve just fallen for Draw-down Termite. Sure, your average annual return is only 0.0% — breaking even — but if you actually stop and do the math, you’ll find you’ve lost money. After the 15% fall, your portfolio is worth $97,750. Your compound annual return is -1.13%.
So what’s going on? Whenever you lose money, it takes a greater return to just break even. If you lose 20%, you must earn 25% to get back to where you began. The more you lose, the worse the situation gets. Lose 50% and you must double your money (grow by 100%) to get back to even.
Most investors focus on what they can gain from their investment in the market — the positive affect of compounding. The investors that consistently beat the market recognize that they must first protect their capital and not lose money. Once they have their plan in place to lower their down side risk, they can focus on generating positive returns that can be compounded over time.
Recognizing Draw-down Termite is the first step to reducing your risk and enhancing your returns. Step up to the table and take control. After all, it is your money.
——————————————————————————————————————–